|
Core research project 1: Long-term variation mechanisms of greenhouse gas concentrations and their regional characteristics |
Research Plan > Core Research Projects > Results of 2006 |
|
[Results of fiscal year 2006] |
|
Large-scale atmospheric monitoring network |
In the present research project, we have started monitoring the atmosphere in the Asia Pacific region, using aircrafts, ships and ground-based monitoring stations.
Figure 1 shows the results of long-term monitoring of the latitudinal distribution of CO2, measured from cargo ships operating on the Japan-Oceania and Japan-Canada routes in the Pacific Ocean. A large seasonal variation as well as a growing trend in CO2 uptake by plants in the Northern Hemisphere can be seen. Figure 2 shows the latitudinal distribution of long-term growth rates of CO2 concentrations and stable isotope ratios. From these results it can be seen that variations in CO2 growth rate depend to a large extent on the annual variation in the CO2 uptake by terrestrial plants. It can therefore be assumed that global warming negatively affects CO2 uptake by plants.
In our atmospheric monitoring by JAL operated aircrafts we measure the vertical CO2 distribution above major international airports around the world. By comparing CO2 concentrations in upper air and surface air, we can obtain information on regional emissions and sinks. The data of the vicinity of Narita airport, shown in Figure 3, imply that the surface area is a large source of emissions in Japan.
Furthermore, we are investigating the behavior of carbon dioxide by studying variations in oxygen concentrations. Although burning things consumes oxygen, plants, on the other hand, produce oxygen, and it is therefore possible to estimate the rate of CO2 uptake and oxygen production by measuring oxygen concentrations in the atmosphere. Figure 4 illustrates the variation in atmospheric oxygen measured at the Hateruma and Ochi-ishi monitoring stations. The figure shows a decrease in oxygen due to fossil fuel combustion. However, the rate of this decrease is somewhat slowed down by the oxygen supply produced by plants. From this we have been able to ascertain that the amount of CO2 uptake by the ocean is about 2 Pg.
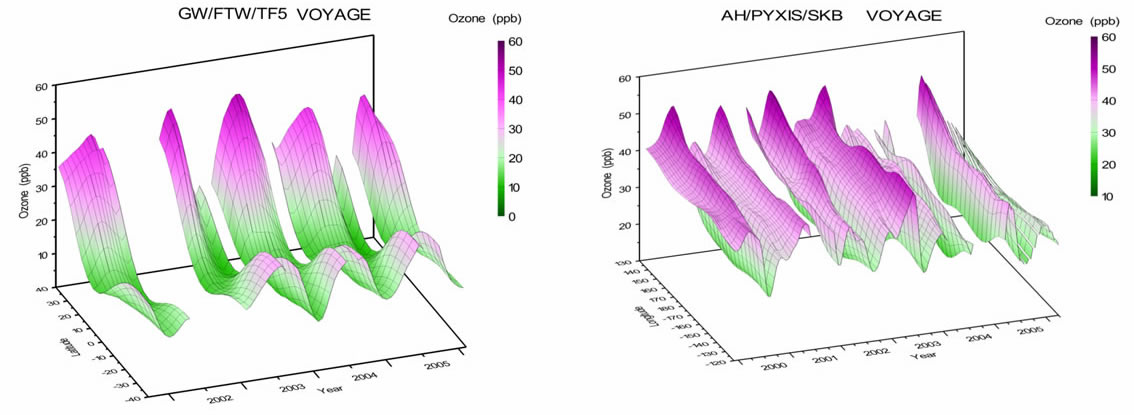
We also monitor major greenhouse gases other than CO2, and we have recently started monitoring the latitudinal distribution of ozone, which has not been well studied yet (Fig.5). Finally, we carry out comparisons between model estimates and detailed observations of CFHCs which have very high global warming potential. |
|
|
Figure 1: Latitudinal differences and time series of air-sea CO2 flux |
|
|
|
(click to enlarge) |
|
Figure 2: Regular ship observation of CO2 concentrations and the rate of isotope change |
|
|
|
|
|
Figure 3: Horizontal distribution of CO2 above Narita airport |
|
|
|
|
Figure 4: Results of oxygen monitoring at Hateruma and Ochi-ishi |
|
|
|
|
|
Figure 5: Results of ozone distribution obtained from ocean monitoring |
|
|
|
Figure 6: Results of continuous monitoring of HFC-134a at Hateruma |
|
|
|
|
Figure 7: Actual and estimated values of HCFC-22 concentration |
|
|
|
 |
|
Monitoring of terrestrial CO2 uptake |
Terrestrial CO2 uptake is greatly influenced by plants and soil organic matter. In the present project, using the COS method we separately measure daytime photosynthesis and plant respiration occurring simultaneously. With this method, we study the individual influence of light and temperature conditions separately on photosynthesis and plant respiration.
Organic carbon accumulated in the soil returns to the atmosphere in the form of CO2 due to decomposition and soil respiration. Therefore, we monitor changes in the carbon budget and the effects of climate change in cold climatic areas, especially in the grasslands of the Tibetan Plateau, where soil organic carbon accumulation is substantial.
At the same time, we also conduct field experiments on heating the soil to artificially create climate change, in order to study change in the decomposition rate of soil organic carbon under similar conditions to those occurring in nature. |
|
|
Figure 8: Studying methods to separate photosynthesis and respiration |
|
|
|
Figure 9: CO2 uptake monitoring equipment in the grasslands of the Tibetan Plateau |
|
|
(click to enlarge) |
|
Figure 10: Examples of field studies on the effects of global warming on soil respiration |
|
|
|
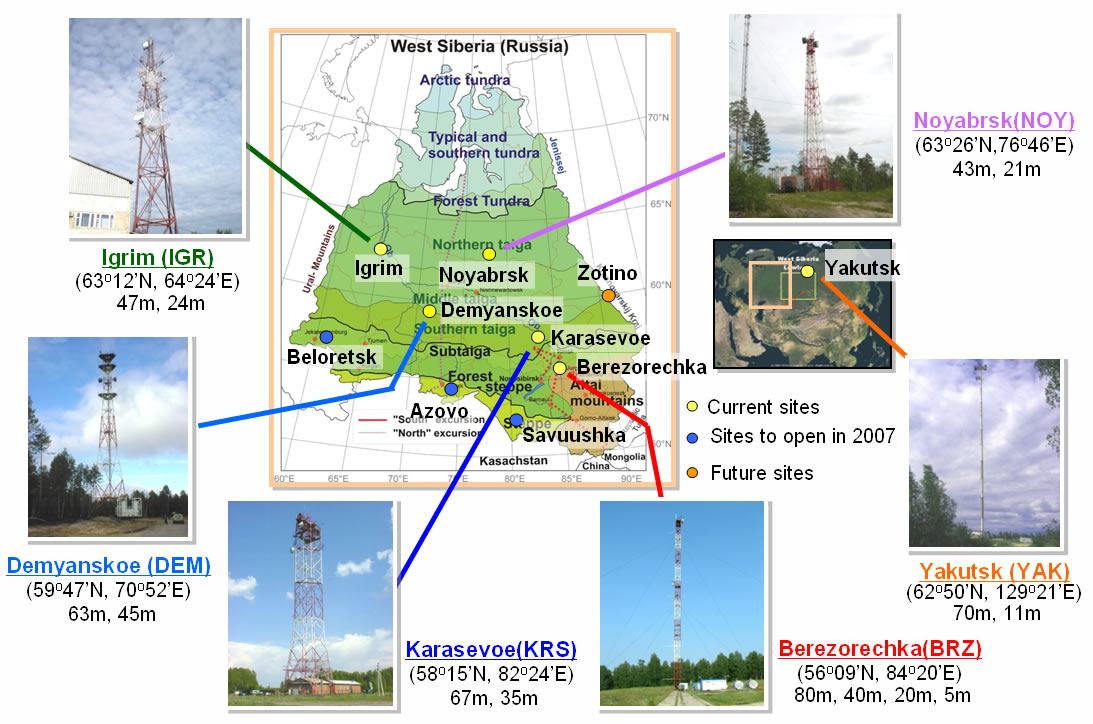
Measurements and model simulations of terrestrial CO2 uptake in Siberia |
We are collecting continuous observation data at 7 flux sites in Siberia. Fitting these data to an inverse model, we conduct experiments on the yearly amount of CO2 uptake and its seasonal variation in the region. |
|
|
(click to enlarge) |
|
|
|
|
・Overall, the Flux values of Sim-CYCLE and the inverse model are at the same level.
・The pattern of the seasonal variations of both observations and model calculation is congruent.
・The simulated value is high in October.
・The Sim-CYCLE estimated generally higher values than the inverse calculation. |
|
|
Figure 11: Comparison between measurements made from observation tower in Siberia and estimates of CO2 uptake derived by the inverse model |
|
|
|
Monitoring the variations in oceanic uptake |
We are also monitoring the Pacific Ocean to see whether there are regional differences in CO2 uptake and whether variations in CO2 uptake have long-term trends. |
|
|
Figure 12: Estimates of oceanic CO2 uptake (by Taro Takahashi) |
|
|
(click to enlarge) |
|
Figure 10: Example of long-term variation in oceanic CO2 uptake |
|
|
|