Recent Research Results Influences of aerosols and thin cirrus clouds on GOSAT XCO2 and XCH4 using Total Carbon Column Observing Network, sky radiometer, and lidar data
The column-averaged dry air mole fractions of CO2 and CH4 (XCO2 and XCH4, respectively) have been retrieved from short-wavelength infrared (SWIR) spectra observed by the Greenhouse gases Observing SATellite (GOSAT). Continuous observations by GOSAT have been made since 2009, but there have been few investigations of the effects of aerosols and cirrus clouds on the retrieved values.
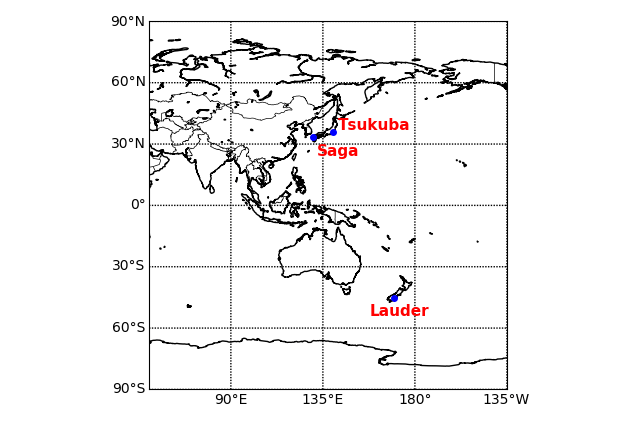
In this work, we investigated the relationship between aerosols and cirrus clouds and the differences between GOSAT observations and Total Carbon Column Observing Network (TCCON) data for XCO2 and XCH4 (ΔXCO2 and ΔXCH4) at three sites: Tsukuba and Saga in Japan, and Lauder in New Zealand as shown in Figure 1. We used aerosol optical thickness (AOT), Angstrom exponents (AEs), and single scattering albedo (SSA), all obtained from sky radiometer observations, as well as vertical profiles of aerosols and thin cirrus clouds from lidar observations. Matchups for the data were performed within ± 0.1° latitude/longitude rectangular areas of each site and within 30 minutes of the GOSAT overpass time.

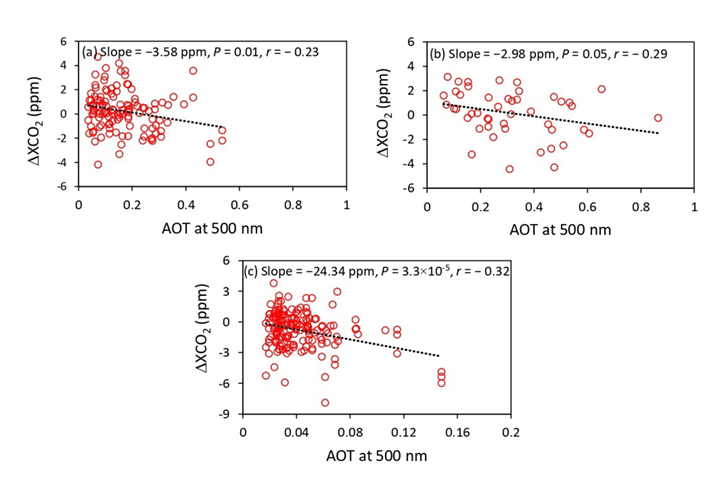
The results showed the negative regression slopes of ΔXCO2 against AOT at a wavelength of 500 nm from sky radiometer data at all sites as shown in Figure 2, although the AOT at Lauder was generally small. The GOSAT ΔXCO2 values would tend to be lowered in the presence of cirrus clouds and dense boundary-layer aerosols. A significant negative ΔXCO2 was also observed at the times of large AOTs that would result from dust-like events.

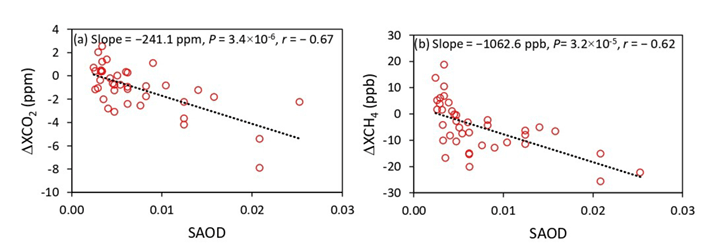
At Lauder, the SAOD (stratospheric aerosol optical depth) estimated from lidar observations showed the large negative slopes of ΔXCO2 and ΔXCH4 as shown in Figure 3, despite the SAOD are small. Both ΔXCO2 and ΔXCH4 were significantly and negatively correlated with AOT during Sep-Oct-Nov.


