|
Core Project2. Greenhouse gas observation from space and use of the observations to estimate global carbon flux distribution |
Research Plan > Core Research Projects > 2008 Research Results |
|
[2008 Research Results] |
This project is being carried out by three research groups, and the results are coordinated by the NIES GOSAT Project Office. The following are the main results obtained in 2008. |
|
Developing and improving algorithms for processing data obtained from satellites |
GOSAT (Greenhouse gases Observing SATellite) observes solar radiation reflected from the earth’s surface, as well as the degree of light polarization. A vector radiative transfer code (Pstar2b) has been developed, making consideration of polarization effects possible when retrieving greenhouse gases. Figure 1 shows the ocean-reflected radiance and its degree of polarization at the top of the atmosphere, simulated by Pstar2b. The radiance and the degree of polarization are strong around the specular reflection point, whereas they become weak in the aerosol loaded atmosphere, due to light diffusion caused by aerosol particles. |
(click to enlarge) |
|
|
Figure 1:
(Left) Radiance of ocean-reflected light.
(Right) Degree of polarization of the reflected light calculated with the NIES Pstar2b radiative transfer model. |
|
|
Empirical research on analytical methods to derive greenhouse gas levels from aircraft and in-situ observations |
To enable the scientific use of GOSAT products, their validation with other data acquired independently is indispensible. We have therefore conducted validation studies after the launch of GOSAT. |
One validation method is using a ground-based high-resolution Fourier transform spectrometer (FTS). We conducted an analysis of solar absorption spectra in the past 6 years using an FTS at NIES. We utilized two methods: profile retrieval that derives concentrations of CO2 at each altitude, and scaling retrieval that derives the column abundance of CO2, assuming its relative concentration at different altitudes. The results obtained by both methods are in good agreement, and show a seasonal variation of 8 ppm and a yearly increase of 2 ppm (Figure 2). These values are also in agreement with values reported earlier. |
(click to enlarge) |
|
Figure 2: Column-averaged CO2 volume mixing ratios (XCO2) |
|
|
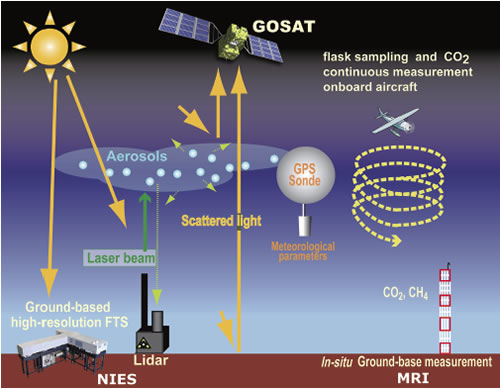
For an accurate validation of GOSAT products with minimum uncertainty, a calibration experiment of validation instruments is required. As shown in Figure 3, measurements of CO2 and CH4 concentrations by equipment onboard aircrafts, and GPS sonde observations were carried out simultaneously with FTS measurements at NIES in January 2009. Measurements were made before the launch of GOSAT, but in the future, synchronized validation experiments will be necessary, as shown in the figure. |
|
|
|
Figure 3: Schematic illustration of the calibration experiments for NIES’ FTS made in January 2009 |
|
|
Development of a global carbon fluxes estimation model |
To process GOSAT data and to estimate CO2 and CH4 fluxes on a sub-continental scale, we use model-simulated estimates of surface CO2 fluxes from natural and anthropogenic sources. The terrestrial biosphere flux is derived by an eco-system model. The ocean-atmosphere flux is calculated by an ocean biogeochemistry model that assimilates the dissolved inorganic carbon in surface waters to the ship-observed values. Figure 4 shows monthly averages of global surface CO2 fluxes simulated by these two models, both developed at NIES. Furthermore, to adjust the model-simulated estimates to GOSAT-made observations, and to estimate the global distribution of atmospheric CO2 fluxes, an atmospheric transport model is used. |
(click to enlarge) |
|
Figure 4: Simulated surface CO2 fluxes (an average value of July 2003 and July 2004) |
|
|
NIES GOSAT Project Office |
Development of GOSAT Data Handling Facility |
NIES GOSAT Project is developing a GOSAT Data Handling Facility (GOSAT DHF), where a huge amount of GOSAT data and other reference data will be processed. Since a large processing capacity is necessary, GOSAT DHF will work together with external data processing centers. As output products, column abundances, as well as the amount of absorption and emission of CO2 and CH4 will be generated. These products will be stored on hard disks and tapes. Regular data processing has started this April. After the validation has been completed, the general user can search and request stored products. |
(click to enlarge) |
|
|
Figure 5: Workflow of GOSAT data processing |
|
|
|