|
 |
|
Core Project2. Greenhouse gas observation from space and use of the observations to estimate global carbon flux distribution |
Research Plan > Core Research Projects > 2010 Research Results |
|
[2010 Research Results] |
This project is being carried out by three research groups, and the results are coordinated by the NIES GOSAT Project Office. The following are the main results obtained in 2010. |
|
Developing and improving algorithms for processing data obtained from satellite |
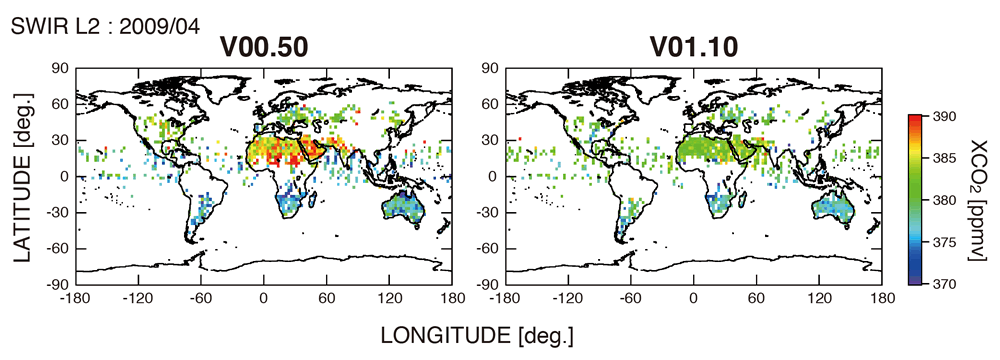
In February, 2010, CO2 and CH4 column-averaged volume mixing ratios (XCO2 and XCH4), derived from the GOSAT observation data of short wavelength infrared spectra under clear sky condition were released (Figure 1, left). Since the results indicated a bias towards extremely high concentrations caused by dust particles and extremely low concentrations due to cirrus clouds, we revised the retrieval algorithm in order to reduce the influence of these conditions. With more accurate cirrus cloud detection through the water vapor absorption band and correction of optical path length modification by aerosols we could solve most of the above problems (Figure 1, right). Data on XCO2 and XCH4 derived with this revised algorithm were released in August, 2010. Nevertheless, the small percentage of the negative bias observed in previous studies still remains even when using the revised algorithm, but efforts are being made to further improve our methods. |
(click to enlarge) |
|
|
| Figure 1: Global maps of the monthly mean CO2 column-averaged volume mixing ratios in 2.5 deg. by 2.5 deg. mesh (example on April 2009). Left: previous version. Right: updated version. |
|
|
Empirical research on analytical methods to derive greenhouse gas levels from aircraft and in-situ observations |
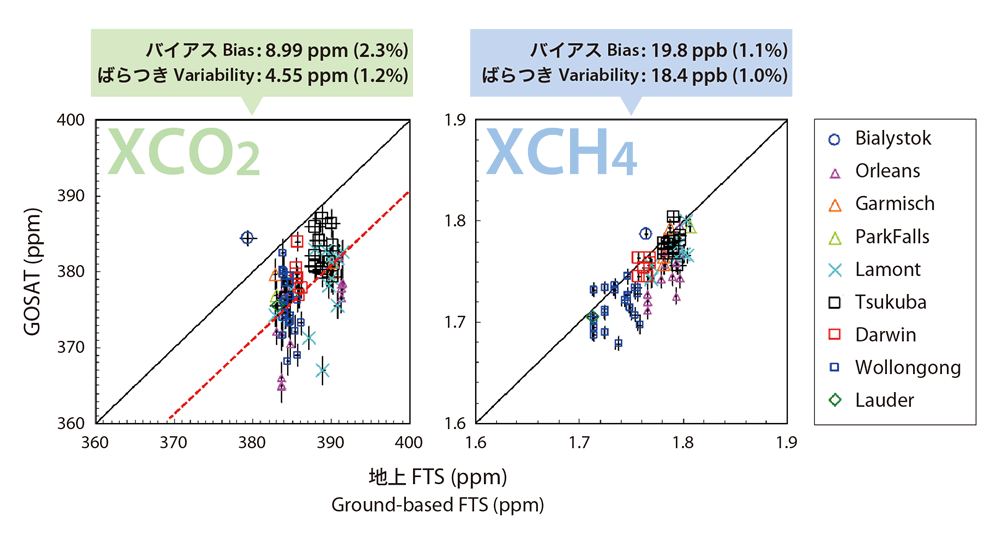
To enable the scientific use of GOSAT products, it is indispensible to compare them with reference data obtained independently from other measuring equipment with less uncertainty, and to analyze the variability and bias. As validation data, we used two kinds of reference data: 1) values derived from column abundance data obtained by a ground-based high-resolution Fourier transform spectrometer, and 2) column abundance data calculated from vertical profiles measured by aircraft.
We conducted verification of the XCO2 and XCH4 data derived by the revised retrieval algorithm. The column abundances and column-averaged volume mixing ratios derived from GOSAT observations were both lower than the reference data, with 2–3% lower for XCO2 and 1% lower for XCH4 (Figure 2). When the negative bias was removed, however, the latitudinal distribution of XCO2 and XCH4 obtained from GOSAT was roughly consistent with that of the reference data. The results of the validation with reference data confirmed that the problem with the bias towards extremely high concentrations caused by dust and extremely low concentrations caused by cirrus clouds could be largely overcome. We plan to further improve our research by clarifying the causes of the bias and by reducing the bias and variability of the GOSAT data. |
(click to enlarge) |
|
| Figure 2: Comparison of GOSAT XCO2 and XCH4 with ground-based high-resolution Fourier transform spectrometers. |
|
|
Development of a global carbon fluxes estimation model |
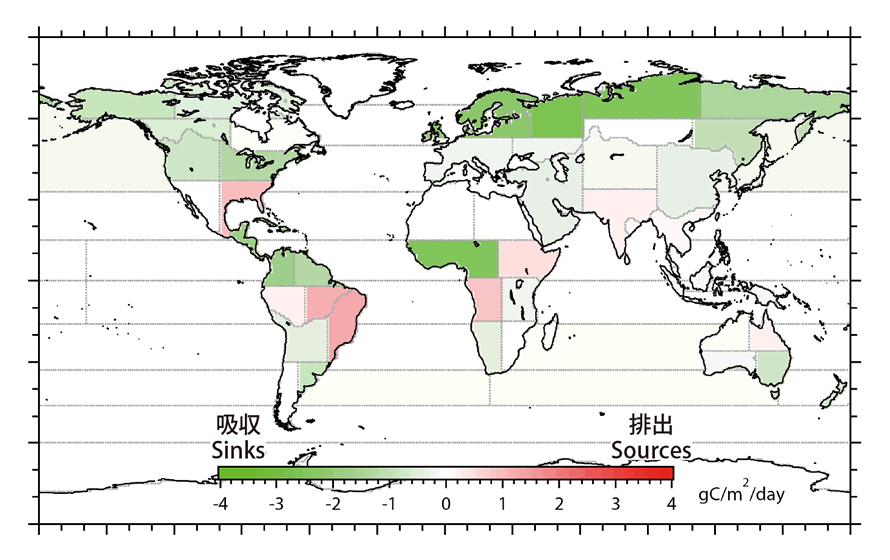
We estimated global surface fluxes of CO2 by a Bayesian inverse modeling method from XCO2 data obtained from GOSAT. The modeling method uses prior data on the fluxes to be estimated, and their quality influences the end flux estimates. Therefore, we constructed a scheme to optimize the major parameters of plant processes in the ecosystem process model VISIT, which is used for estimating the vegetation-atmosphere fluxes. In addition, we prepared a dataset of anthropogenic emissions from the latest satellite observations of global night-time light and monthly emissions data taking into account monthly variations. Using these prior data of surface fluxes and XCO2 data from GOSAT observations, as well as the estimates derived from ground-based measurements, we sought to estimate CO2 fluxes for 64 sub-continental regions (Figure 3). Based on the validation of GOSAT data products, we corrected the biases of the GOSAT XCO2 values, changed them into monthly mean values in a 5° by 5° mesh, and included them in the analysis. As the number of data has increased as a result of the GOSAT observations, the uncertainty in the flux estimates in South America and Africa, where ground-based measuring sites are limited, could be reduced by 30% (tentatively) compared to the values estimated from ground-based measurements only. |
(click to enlarge) |
|
| Figure 3: Tentative CO2 flux values for 64 sub-continental regions estimated from GOSAT XCO2 data and ground-based measurements (August, 2009) |
|
|
NIES GOSAT Project Office |
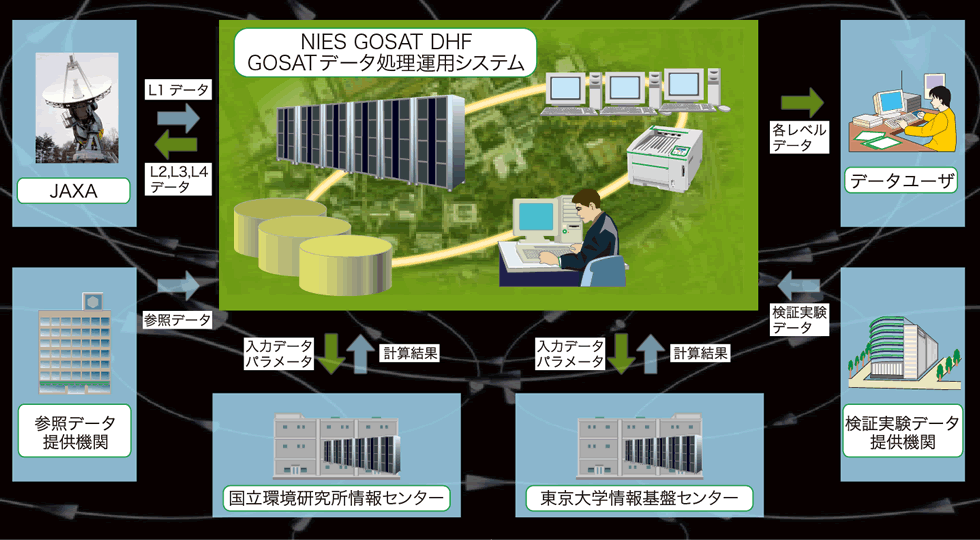
The NIES GOSAT Project has developed the GOSAT Data Handling Facility (GOSAT DHF), where the GOSAT observation data are received from JAXA. Its regular work includes data processing, archiving, and data distribution. Since the processing of the received data and the collected reference data requires a huge processing capacity, it is performed in conjunction with other external computer systems. Some of the typical processed products are column abundances and fluxes of CO2 and CH4. Cloud flag and aerosol amounts necessary for the processing are also calculated from the GOSAT products. After the successful launch of GOSAT on 23 January 2009, these products became available primarily to the researchers whose research proposals were adopted by the Research Announcement Selection and Evaluation Committee. In October 2009, Level 1 spectral data were released to the registered general public, and in February 2010, Level 2 CO2 and CH4 column abundances were released. In November 2010, Level 3 products, such as the global distribution generated from Level 2 products, were released. These GOSAT products can be downloaded at the following website:
http://data.gosat.nies.go.jp |
(click to enlarge) |
|
|
| Figure 4: Workflow of GOSAT data processing |
|
|
|
|
|