|
Core Project3. Assessment of climate risk based on integrated climate, impact, and land use models |
Research Plan > Core Research Projects > 2007 Research Results |
|
[2007 Research Results] |
|
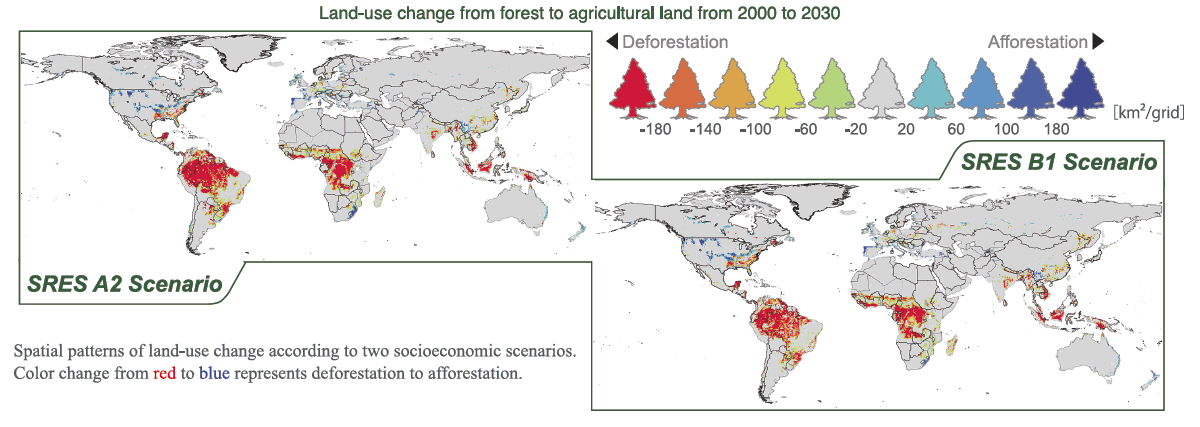
How much forest will disappear in the near future up to the year 2030? |
To understand where and how agriculture land use will affect deforestation, we estimated changes in forest area by using economic models and geographic information. The results indicate afforestation in developed countries, whereas rainforest is in danger of disappearing. |
|
Land-use change from forest to agricultural land from 2000 to 2030 |
|
(click to enlarge) |
|
|
|
The figure shows deforestation and afforestation areas from 2000 to 2030. Intensity of deforestation and afforestation are indicated by area in half degree grid cell. SRES B2 and A2 scenarios agree with global patterns of deforestation, but spatial patterns in Brazil and Africa are different. |
|
|
How will the precipitation change in the near future up to the year 2030?
|
As a preliminary analysis for predicting near future climate change, we conducted 10 modeling experiments with different initial conditions, to focus on studying the annual mean precipitation and the extreme daily mean precipitation (defined as the 4th largest in a year). Increases in precipitation are predicted at high latitudes and in the tropics, even if the uncertainty and influence of decadal natural variability is taken into account. In the subtropics, the sign of precipitation change is weak compared with the decadal natural variability. |
| |
Near future predictions of changes in annual mean and extreme precipitation |
|
(click to enlarge) |
|
Upper panels: The left figure shows the percentage changes in annual mean precipitation for 2011-2030 compared with that for 1951-1970, and the right figure shows the percentage changes in extreme precipitation. The averages from the 10 runs are shown.
Lower panels: The left figure shows how many runs out of the 10 predicted positive (more blue) or negative (more red) changes in precipitation. Green shading indicates the direction of change is uncertain due to the decadal natural variability. The right figure shows the number for extreme precipitation. |
|
|
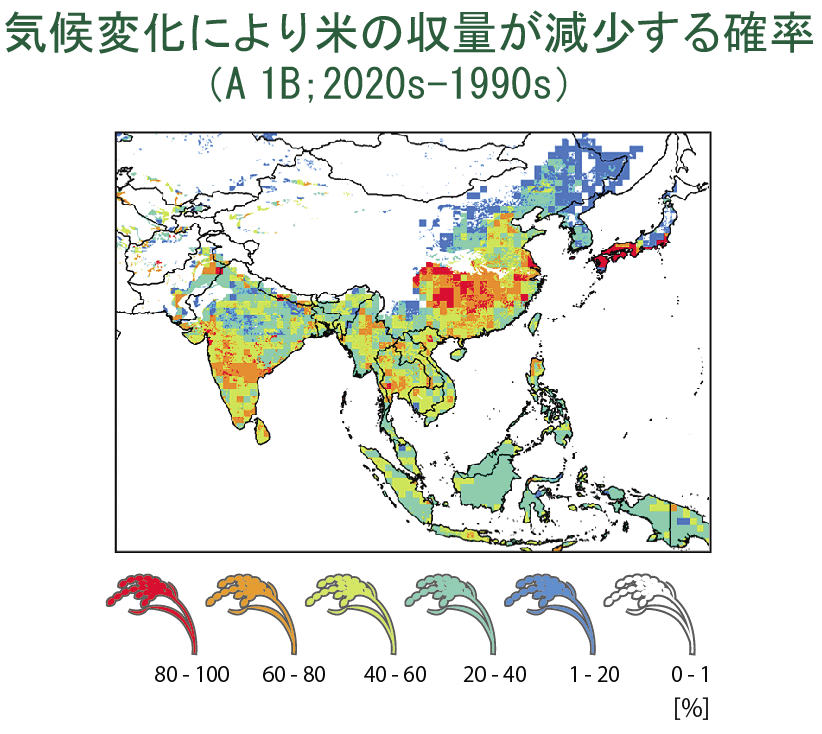
What are the probabilities of a decrease in rice yields due to climate change? |
It is important to take uncertainties of future climate projections into consideration in assessing the impacts of climate change. To consider the uncertainties, we used future climate projections by 18 general circulation models developed by universities and institutes around the world, estimating the probability of a decrease in rice yields due to climate change. The results show high probabilities of yield decrease across a wide area in Asia. |
|
The probabilities of a decrease in rice yields due to climate change |
|
(click to enlarge) |
|
The figure shows the probabilities of a decrease in rice yields due to climate change in 2020s compared to 1990s. It indicates that the probabilities of yield decrease are high in western Japan, southern China, Indochina, and India. The future emission scenario used is SRES A1B. CO2 fertilization effect is considered, but this is small in 2020s. |
|
|
|